Press: figures, graphics and how to cite
For anyone reporting on data centers in Sweden. Here are the figures we stand behind, what they do not say, ready-made maps and charts, and how to credit us.
The figures as of 2026-11-20
- 70confirmed facilities and projects46 with a full record, 24 in the inventory
- 38operationala further 5 have an unclear status
- 27under construction or planned5 under construction, 22 planned
- at least 142 MWpublished power in operationstated for 11 of 38 facilities
- at least 2,273 MWpublished power in the pipelinestated for 13 of 27 projects
- 47operators and developersin 43 municipalities and 16 counties
- Every figure counts what we have confirmed from a source we have opened. The figures are therefore floors, not estimates for the whole country.
- Companies' in-house server rooms are largely missing, because they are rarely disclosed.
- Power is the sum of published MW figures. They are of different kinds (IT power, facility power, grid connection) and cover only the facilities that state one. Read it as “at least”, never as installed capacity in Sweden.
- Planned projects count with their announced power, which may describe a fully built site many years ahead.
- We publish no figure for investment or electricity use, because the evidence does not support a figure we can stand behind.
All statistics · Every facility with its source
How to cite
Credit DataCenterSweden, give the date of the figure and, if you can, link to the page. Write “at least” before counts and power: the figures count what is confirmed, not everything that exists.
According to DataCenterSweden's register there are at least 38 data centers in operation in Sweden (2026-11-20).
Source: DataCenterSweden, datacentersweden.se
- Facts about a single project: link to the project page, where every fact has its source and the date we checked it.
- DataCenterSweden is privately published and is not an authority. Do not call the figures “official statistics”.
- Data and graphics are free to reuse with credit.
Maps and charts to embed
The graphics are redrawn every time the site is updated and stay at the same address, so an embedded graphic stays current. The date is printed in the graphic.
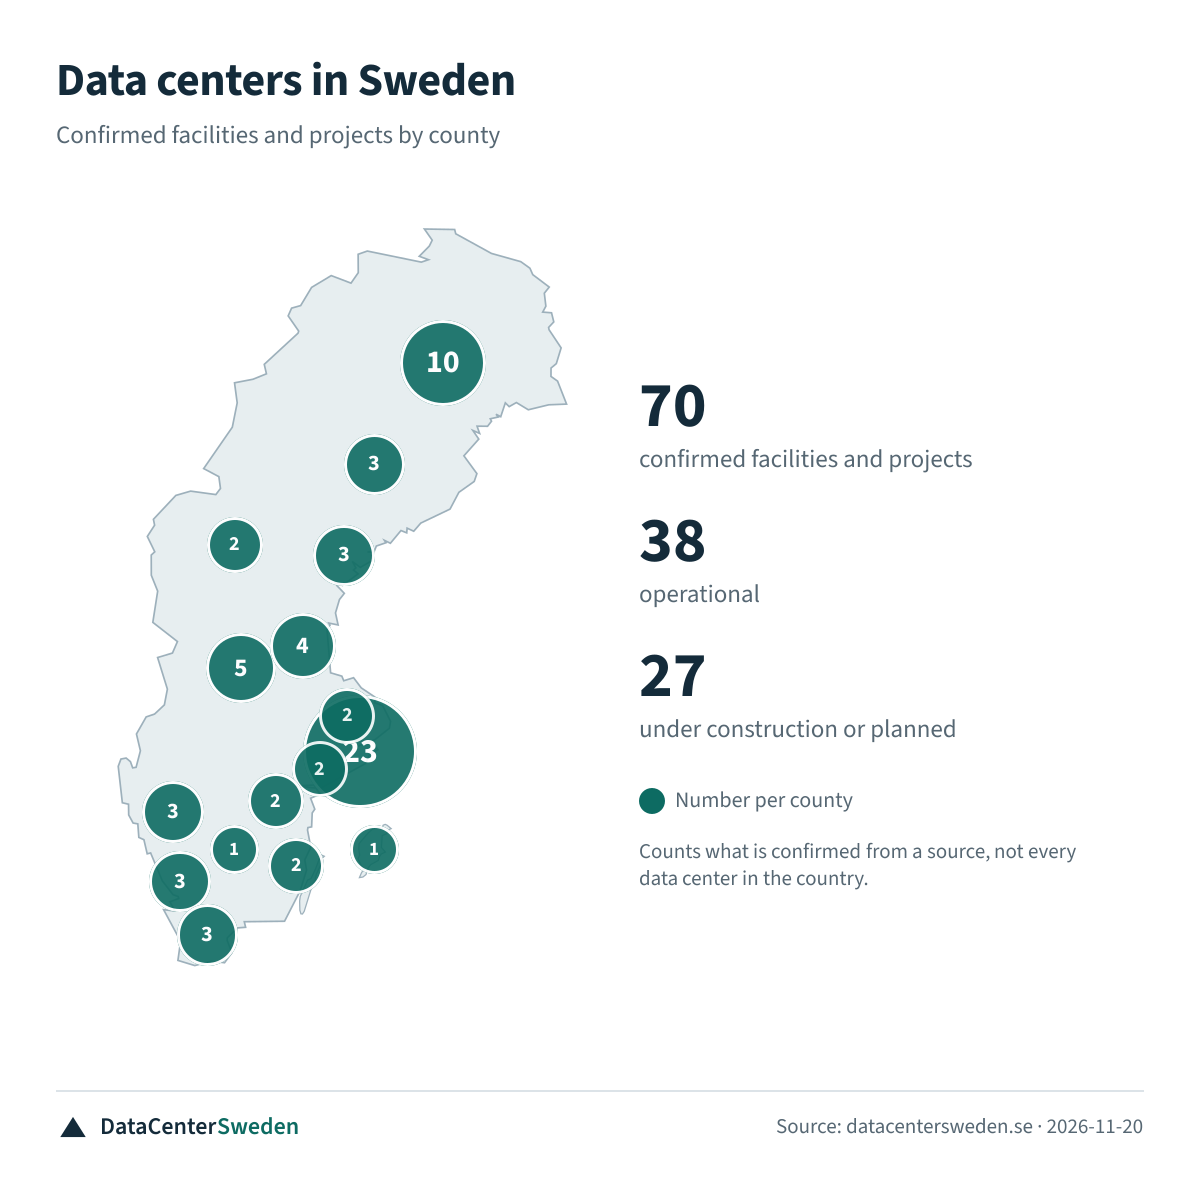
<a href="https://datacentersweden.se/facilities/"><img src="https://datacentersweden.se/press/datacenter-sverige-karta-en.png" alt="Map of data centers in Sweden" width="1200" style="max-width:100%;height:auto"></a>
<p>Source: <a href="https://datacentersweden.se/facilities/">DataCenterSweden</a>, 2026-11-20</p>
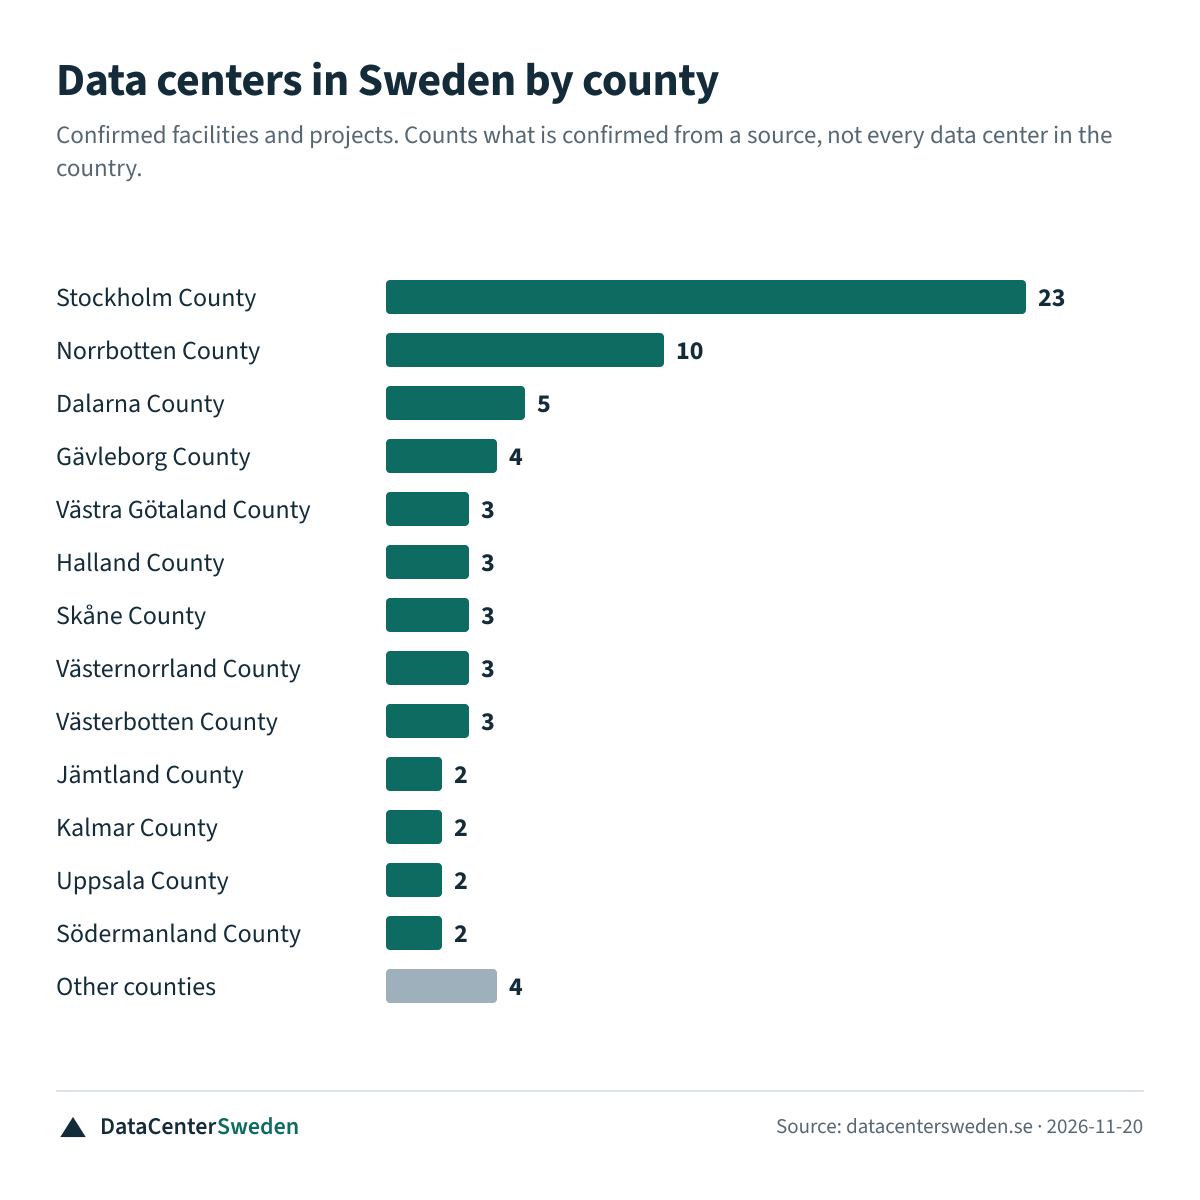
<a href="https://datacentersweden.se/facilities/"><img src="https://datacentersweden.se/press/datacenter-sverige-lan-en.png" alt="Data centers in Sweden by county" width="1200" style="max-width:100%;height:auto"></a>
<p>Source: <a href="https://datacentersweden.se/facilities/">DataCenterSweden</a>, 2026-11-20</p>
Press contact
Questions about figures, method or a single project: kontakt@datacentersweden.se. Put “Press” in the subject line. We answer on weekdays.
Found an error? Report it here. Corrections are published openly on the corrections page.
How we work
- Every fact has a source that we have opened and the date we checked it. What cannot be confirmed is shown as unknown.
- We go through municipal notice boards, county administrative boards' notices and the Energy Markets Inspectorate's cases for the projects in the register every week.
- The editorial team is separate from the commercial work. Read about ownership and commercial relationships.